Measures of Center
ABOUT:
#Becoming a world-class data scientist. I am an intelligent, highly motivated, purpose-driven and result oriented data scientist passionate about learning new technologies and solving problems in society through data-driven workable and effective solutions.I possess a tough mentality and natural leadership skills. I am enthusiastic about new challenges and learning new technologies in the field of data science and machine learning to increase knowledge and efficiency. I am also advocating for developers with interest in data science
The title of this article reminds me of a game I played as a little girl, we would stand next to each other forming a circle as we lock our hands together in order to prevent the individual in the middle from escaping, lol, Let's get to the business of the day.

Introduction
Measures of center often called measures of central tendency is a concept of descriptive statistics (Descriptive statistics is the term given to the analysis of data that helps describe a given dataset) that gives information about the general mass of observations. Better defined as a single value that tries to to describe a dataset by identifying the central position. The measure of central tendency which appropriately describes the central position of the data depends greatly on what level of measurement the data set has and the type of data you are attempting to describe.
Common measures of center
There are three widely accepted measures of center, they are:
1. Mean:
The mean is often called the average or the expected value in mathematics. We calculate the mean by adding all of our values together, and dividing by the number of values in our dataset.
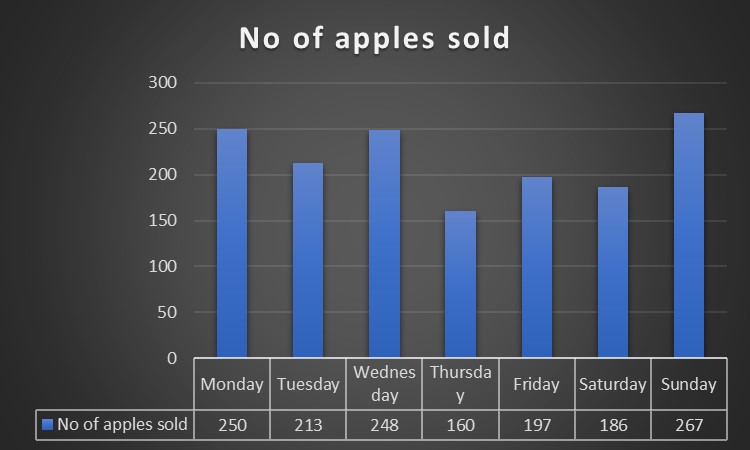
Example: Assume the position of the manager of an apple store that makes sales everyday of the week, given the data from sales of a given week as shown above . How many apples do you expect to sell in a day?
Solution:
The word expect in the sentence invariably points at the mean. The mean is the sum of observations divided by the number of observations as earlier said.
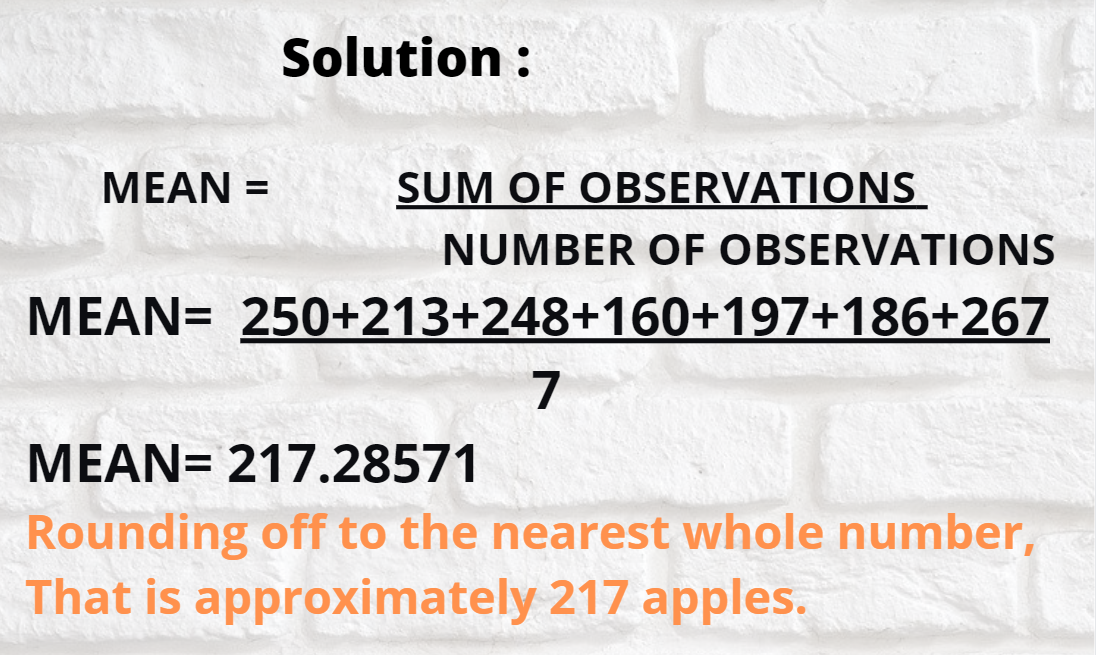 You see, the manager expects to sell 217 apples everyday.
Calculating mean in python :
Be sure to have the numPy library installed, 😥 don't have it yet ?🤗.Run pip install numpy
import numpy as np
apples= [250,213,248,160,197,186,267]
mean_apple=np.mean(apples)
print(mean_apple)
2. Mode:
Just like the traditional weighing scale, imagine the two sides are labeled A and B, and each time a load greater than the weight of side A is added to side B, you see a lag in side A, the average weight will definitely not account for the lag. Likewise, there exists data that cannot be perfectly described by the mean of the observation.
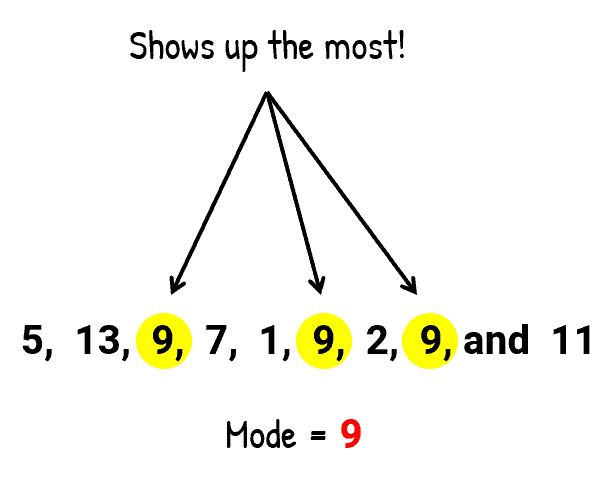
The mode of records is the value that occurs most often.
Example: Now your store has grown bigger, you now sell all types of fruits (mangoes, apples, pineapples, oranges,...., pawpaw), you have got data of sales for a week. nowhere is the question. What fruit do you think, you would sell every day?

Solution: still thinking🤔... Yeah, you guessed right, the fruit you sold the most that week.
Calculating mode in python :
We will use sciPy library to find the most frequent number. Run this;
from scipy import stats
numbers=[5,13,9,7,1,9,2,9,11]
mode=stats.mode(numbers)
3. Median:
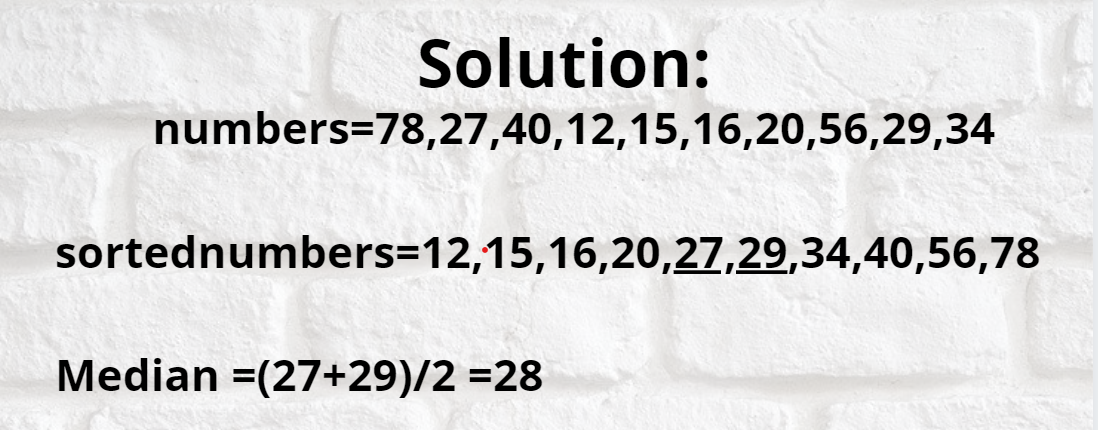
The third measure of central tendency is the median, which is the value of the middle term when all the records are arranged in ascending order. The median of a set of records, given that the number of records is even, is the mean of the two numbers at the middle.
Let's look at an example: Given a set of numbers (78,27,40,12,15,16,20,56,29,34), find the median.
Solution: Remember, median is the middle number, observe that you were given 10 numbers
Calculating median in python :
import numpy as np
numbers= [78,27,40,12,15,16,20,56,29,34]
x = np.median(numbers)
print(x)
Conclusion
Measures of center are greatly used in data analysis and machine learning to clean up tabular data(fill in missing values). It's time to clean up some data😍. Thanks for reading🎉